How to implement business intelligence like healthcare business intelligence? Business intelligence implementation is a set of activities that make a BI solution available for use in your organization. We have been providing BI implementation services since 2010. In this article, we talk about BI implementation steps you need to take to realize the full benefits of this technology.
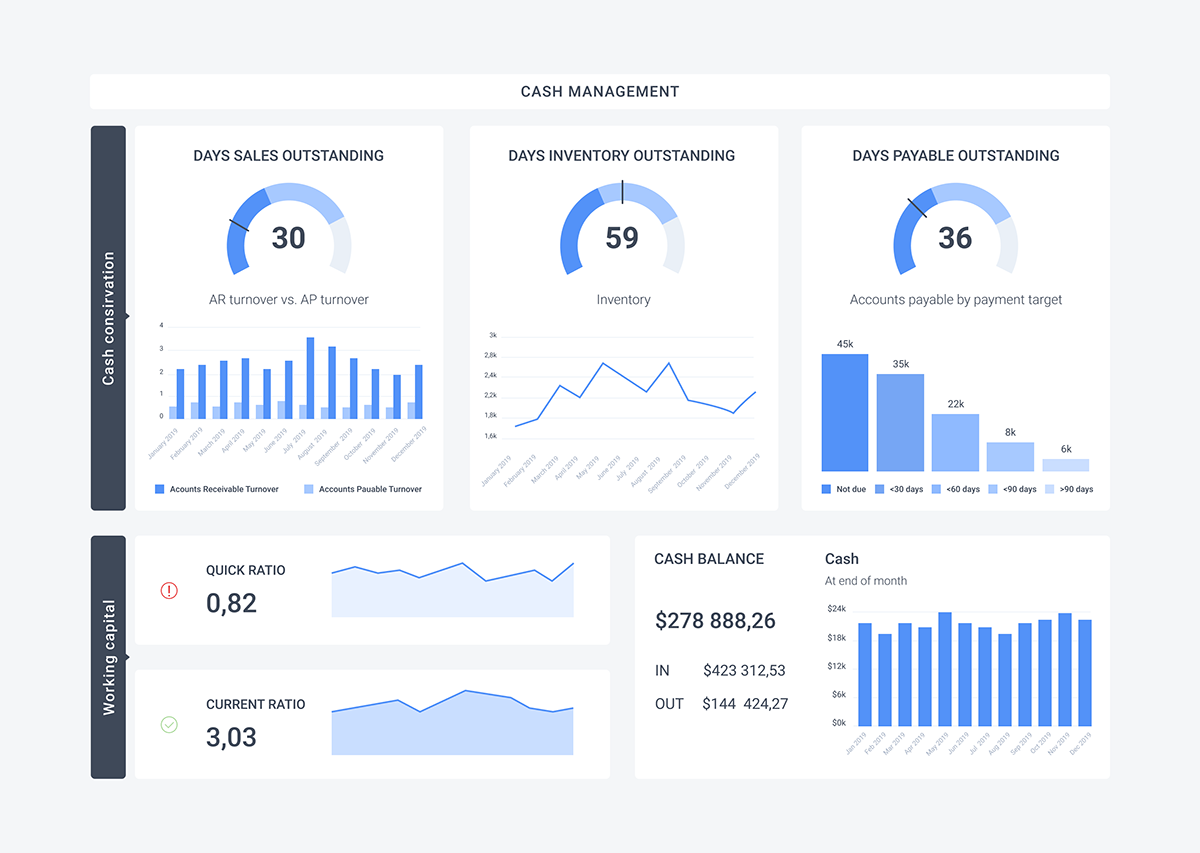
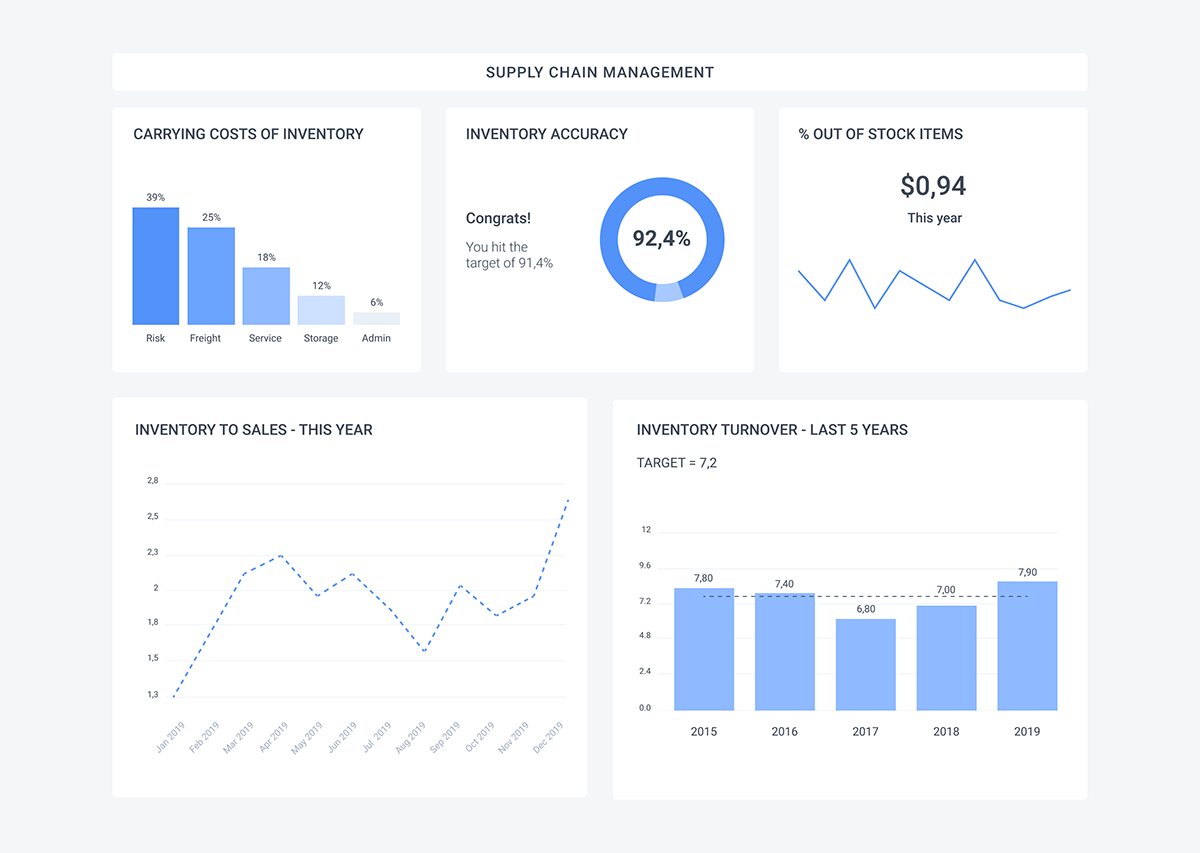
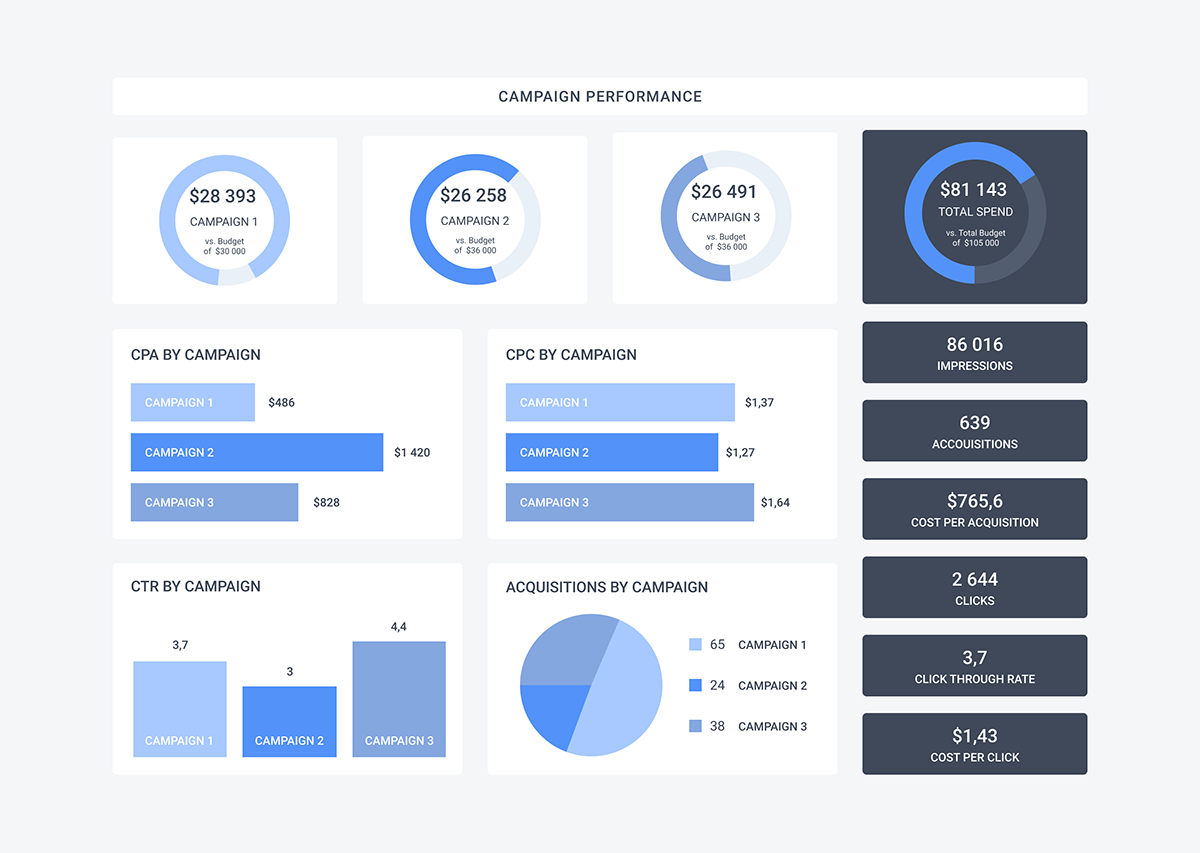
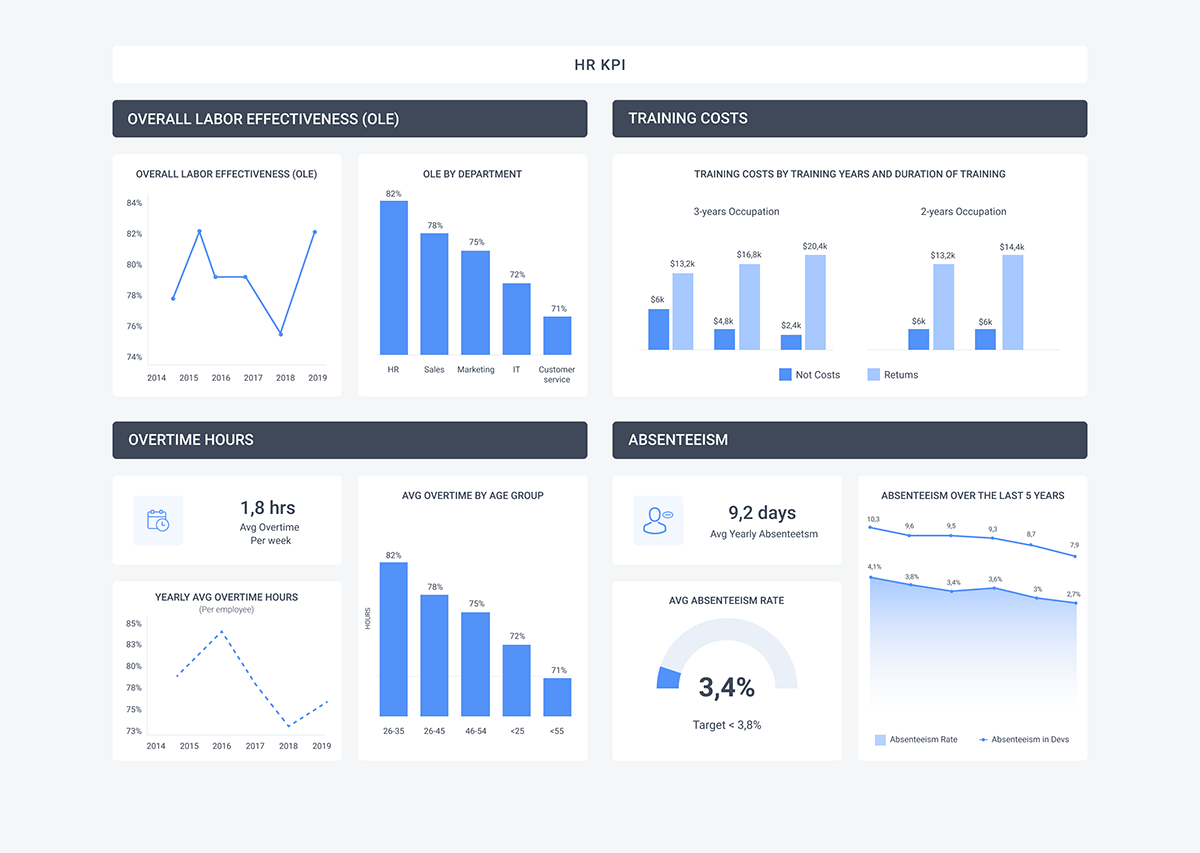
We transform your big data into rich data: dashboards and reports (Excel, Power BI, Web, etc) that are easy to use for making management decisions and get them working for your business. Our prebuilt reporting tools (for the C-Level, Sales Intelligence, Customer Intelligence, Marketing Intelligence, Financial Business intelligence, Supply Chain Intelligence, HR Business Intelligence, and other) let us speed up BI implementation.
BI Project Implementation Steps
1. BI Requirements Gathering, Resource and Funding Plan
Do you have a detailed specification document for your new BI system?
This document will let you conduct a step-by-step check of your finished BI solution to see whether it conforms to your wishes at the beginning of the project. Besides, this is the only basis for understanding what your Resource and Funding Plan should be.
Which questions should the specification document answer?
- Which employees would use the system?
- Which business processes that you need to digitize are they responsible for?
- Which KPIs and metrics do you need to track in your BI reporting system?
If you don't have a detailed specification document for your new BI system we will provide you with a BI Business Analyst, who understands the peculiarities of your business processes and can prepare such a document.
Our analyst maps out the business processes of your enterprise:
- He describes the connections between the business processes.
- The document lists all the enterprise's functions and key stakeholders responsible for each of them, as well as KPIs and other measures for all the functions.
The resulting map becomes a foundation for the specification, as well as the framework for the future BI system, allowing the correct role-based access model to be developed (which employees will have access to what information) and letting the executives see the relations between the business-critical parameters.
The specification is used as a foundation for a Resource and Funding Plan. It will show you:
- Implementation steps;
- Implementation timeline;
- Implementation costs (human resource involvement on both your and our sides, and project budget).
Tell us which core business processes do you need to control and we will provide you with an optimal set of well established KPIs specific to your business.
2. Design and Build a Data Warehouse for Business Intelligence Implementation
We have started to implement your BI project.
The purpose of this step is to integrate different sources of your data (Databases, Flat Files, Marketing Analytics, Social Media, CRM/ERP, Helpdesks, etc.) into a single unified source - a so-called “Data Warehouse” database or set of databases.
Let us know which data sources do you need integrated with your BI solution?
Data Warehouse Implementation Steps
1. Developing the data storage structure of the Data Warehouse: which table to use for which kind of data (physical data structure).
2. Developing scripts for each data source to:
a) Extract data from them;
b) Check data for duplication and other errors, transform the data to fit the technical requirements of the Data Warehouse;
c) Load the processed data in the Data Warehouse;
This step is called “ETL processes configuration” (ETL stands for “extract”, “transform” and “load”).
3. Tuning the Data Warehouse to conduct complex calculations - do the so-called “Data Enrichment configuration”.
Why do you need this?
a) If you need to add value to your existing data by using ABC(XYZ)-analysis, ranging, categorization, forecasting, modeling, etc., you need resource-intensive calculations.
b) You probably know what it’s like to see Excel freeze or stop working. One of the causes of these issues is trying to use Excel for calculating complex metrics, not just to visualize data. Using large amounts of data or complex formulas exacerbates this problem.
According to the best practices in BI development, complex data, including KPIs, should be calculated at the database level (backend) not the visualization tool level (frontend). This will ensure your business reports work quickly and reliably.
4. Connecting Data Warehouse database with OLAP Cube database.
Forming reports for your specialists based on the data stored in the Data Warehouse requires a dedicated developer manually writing database requests. This is, of course, unacceptable for a modern business, so you need to use one more technology - an OLAP Cube database.
For example, you need to create a multidimensional report. Your Data Warehouse has three tables: sales by date, sales by locations, sales by products.
To get a report about the amount of a certain product sold at a certain shop at a certain date the developer needs to write two requests to the Data Warehouse: about the sales on a certain date and about sales at a certain shop. And another request to consolidate the data. This looks inconvenient even at such a simple example.
Yet after the OLAP Cube is prepared you don’t need a programmer for making multidimensional reports. Getting one only takes a standard Excel request. The OLAP Cube will do the heavy lifting, as it will have the necessary data and each sale would have the necessary dimensions (“date”, “shop”, “product”).
3. BI Data Visualization
The previous steps let us creating the databases and making sure the data is correct. Now we need to work on the Dashboards, Scorecards, and Reports.
This step brings you the interfaces that will be used by you or your employees daily.
There are three kinds of interfaces: Dashboards with graphs, Scorecards, and Spreadsheet Reports
Dashboards
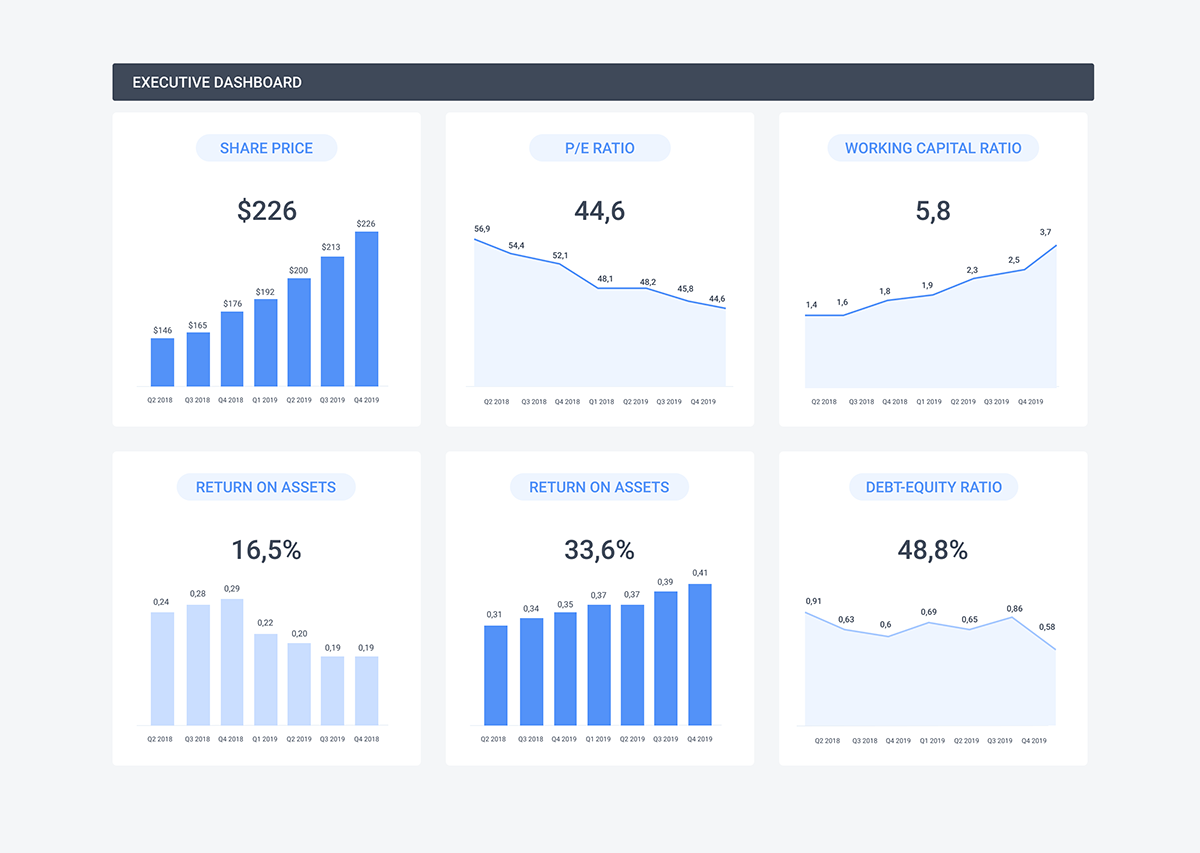
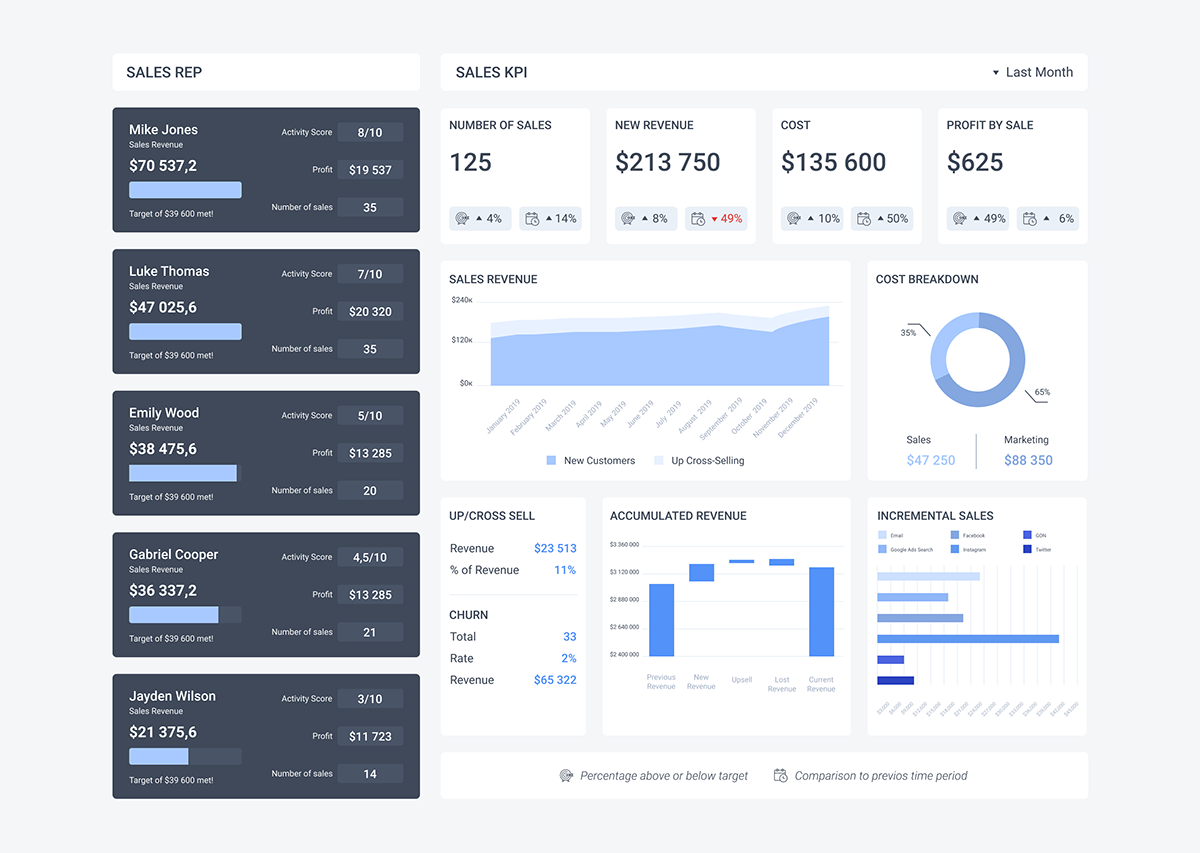
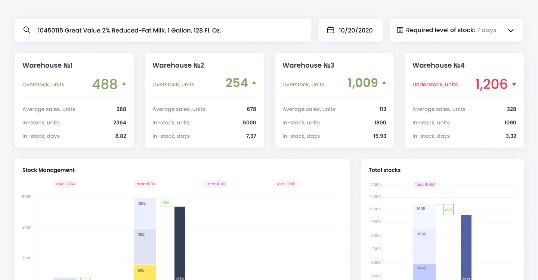
The purpose of the dashboards is to show (even in real-time) the current state of the most important high-level metrics (both for specific processes and the business as a whole), the total indicators. Usually you can’t trace the cause-and-effect relationships here, but that isn’t the goal anyway. Graphs are often present.
Scorecards
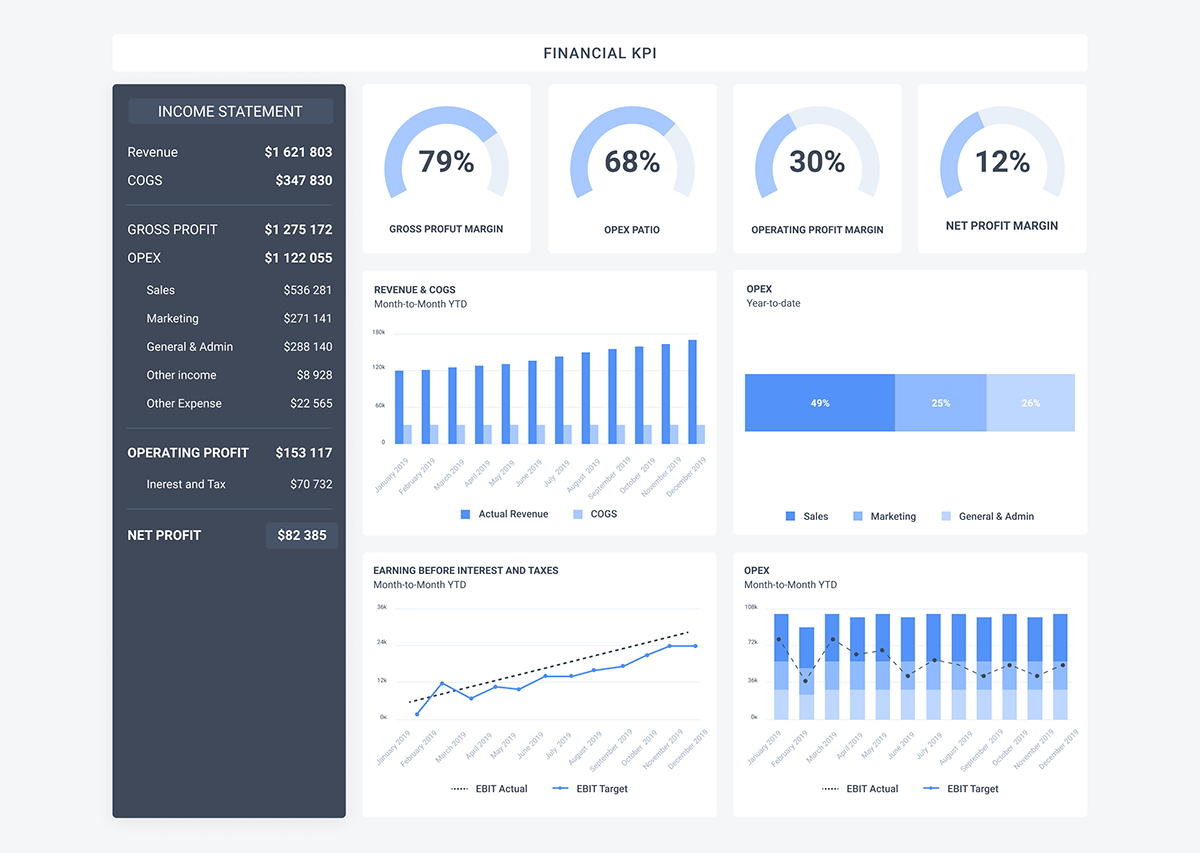
Scorecards - are a type of dashboards. The difference lies in their purpose. Scorecards demonstrate how the KPIs are being fulfilled (comparison with the planned results and showing deviations). This can be done for separate processes and the business as a whole.
Reports
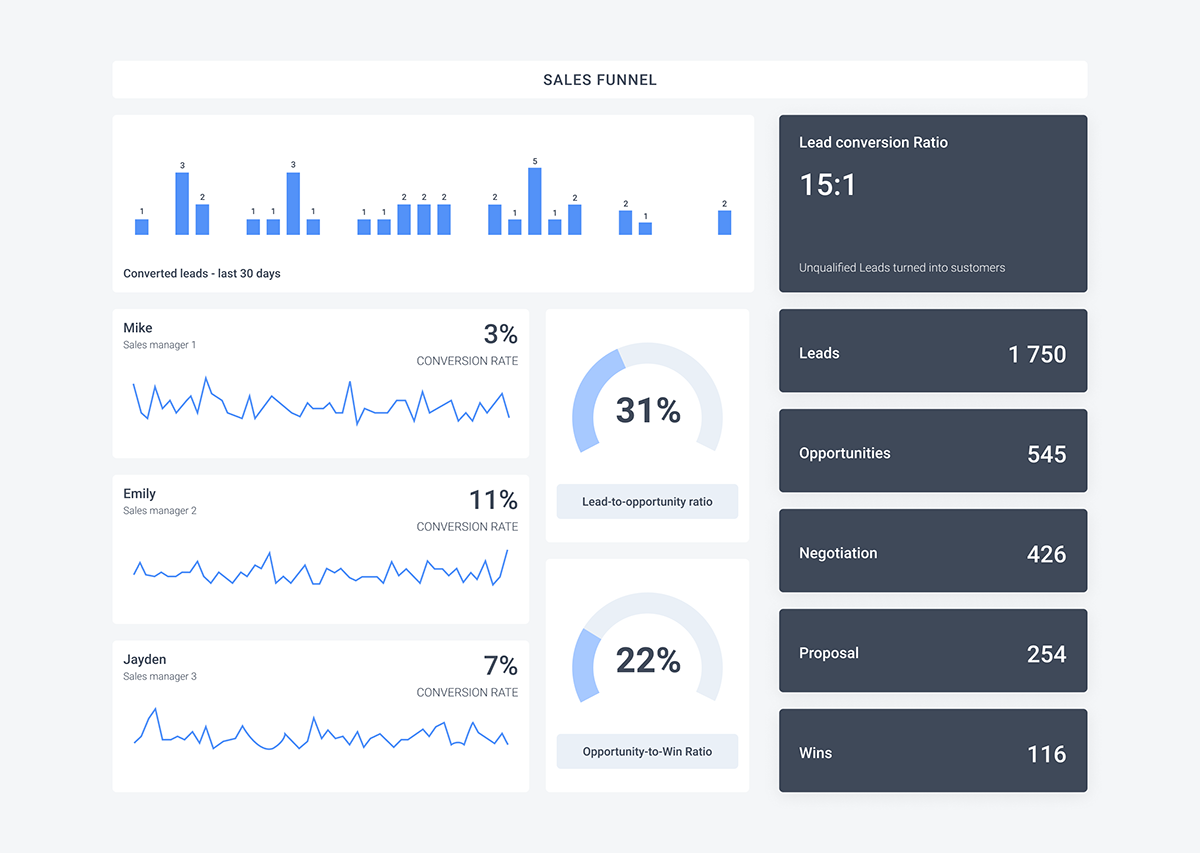
The reports are made to establish the cause-and-effect relationships and a structure within a specific process (the data is later summarised and used for dashboards).
The reports can be pre configured or easily and conveniently adapted by the users themselves without involving analysts, data scientists or IT specialists (self-service multidimensional reports).
4. BI Deployment
You can see the whole picture only after all the previous steps have been completed. Now you know that everything (both calculations and visualizations) works quickly enough (done within a few seconds) and don’t overstrain servers and user computers (so you don’t have to purchase any additional expensive equipment).
This is also the time to decide on the optimal periodicity to automatically refresh your dashboards and reports. For example, IOT data needs to be updated in real-time (which leads to higher hardware requirements), but there is no reason to update the ABC-analysis data more often than once a month.
5. BI Security configuration
1. You would probably like to delineate the information access rights for the employees in different positions (e.g. they don’t need to know their co-workers’ salaries unless it is required as part of their duties). We prepare the role-based security that guarantees you flexible control (ease of adding/deleting new users and assigning rights).
2. We sign an NDA with you, providing you with legal protection of your data used over the course of the BI solution development and implementation.
6. BI Training
We conduct a brief intensive training on tuning and using the system for different kinds of your users, including data engineers, business analysts, and business users.
Rate this article
Portfolio

Our Clients' Feedback





Belitsoft has been the driving force behind several of our software development projects within the last few years. This company demonstrates high professionalism in their work approach. They have continuously proved to be ready to go the extra mile. We are very happy with Belitsoft, and in a position to strongly recommend them for software development and support as a most reliable and fully transparent partner focused on long term business relationships.
Global Head of Commercial Development L&D at Technicolor